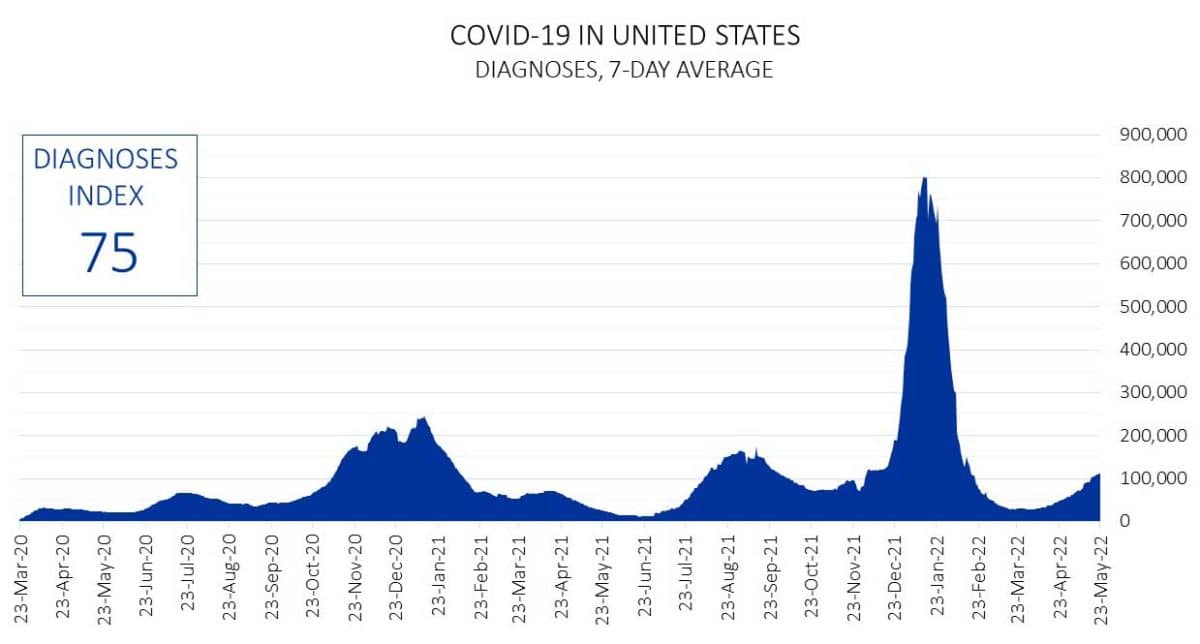
 This chart shows the seven-day average number of COVID-19 diagnoses in the United States. On a scale of 0 to 100, the diagnoses index quantifies the current level of diagnoses by using a comparison with daily levels since the start of the pandemic (the higher the index, the more severe the current state of the pandemic is). The current number of diagnoses in the U.S. is higher than 75 percent of preceding days. Sources: New York Times. Created by Eli Ben-Naim