







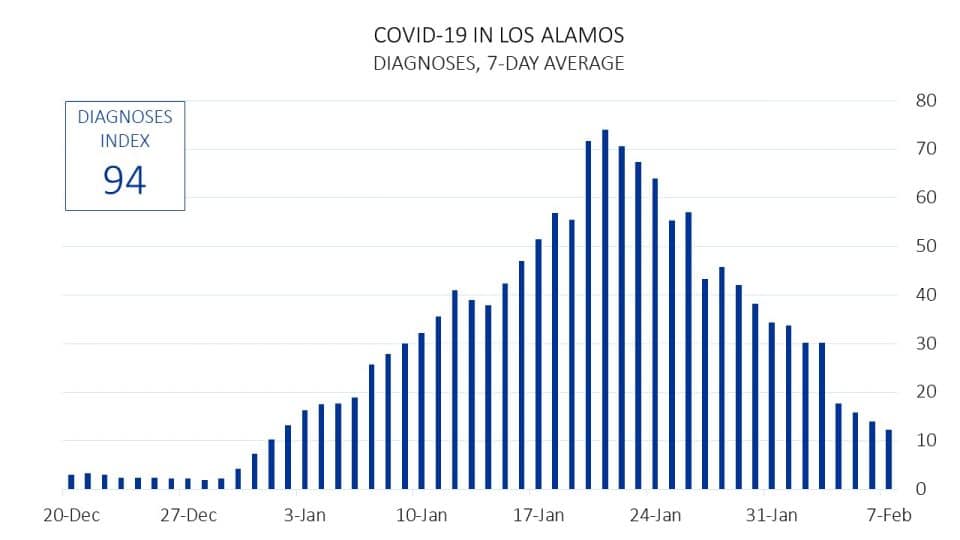
 This chart shows the seven-day average number of COVID-19 diagnoses versus date in Los Alamos. On a scale of 0 to 100, the diagnoses index quantifies the current level of diagnoses by using a comparison with daily levels since the start of the pandemic (the higher the index, the more severe the current state of the pandemic is). The current number of diagnoses is higher than 94 percent of preceding days. Source: New Mexico Department of Health. Created by Eli Ben-Naim
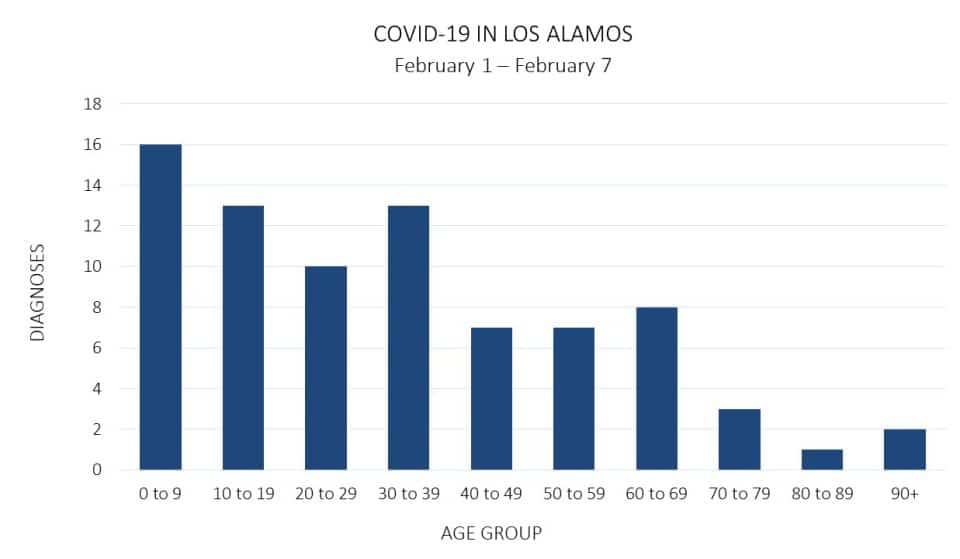 This chart shows the number of COVID-19 diagnoses by age group for the past week in Los Alamos. Source: New Mexico Department of Health.

 By JACCI GRUNINGER,
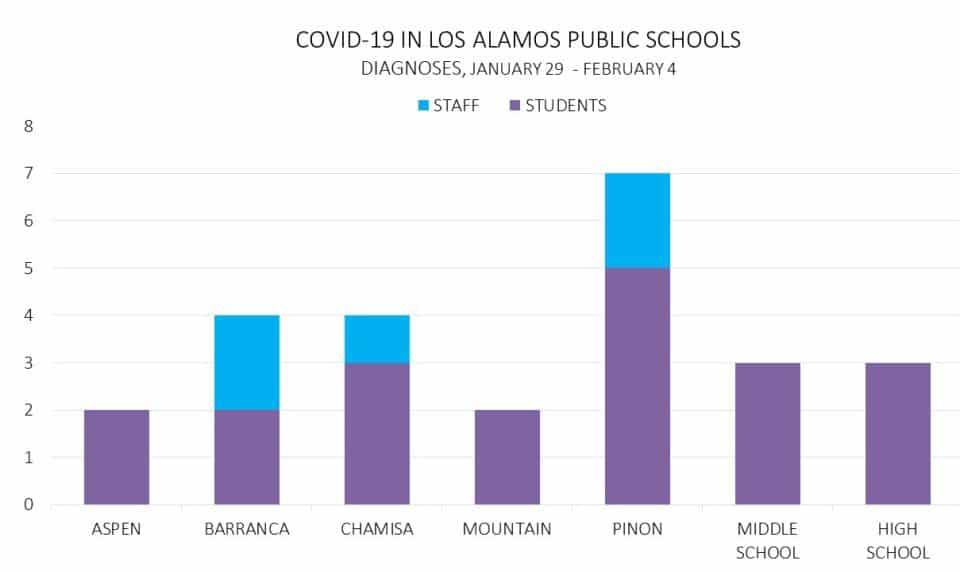 The bars in this chart display the number of COVID-19 diagnoses by school for the past school week. Source: Los Alamos Public Schools. Created by Eli Ben-Naim
 HB 52 Co-sponsor Rep. Christine Chandler (D-Los Alamos)
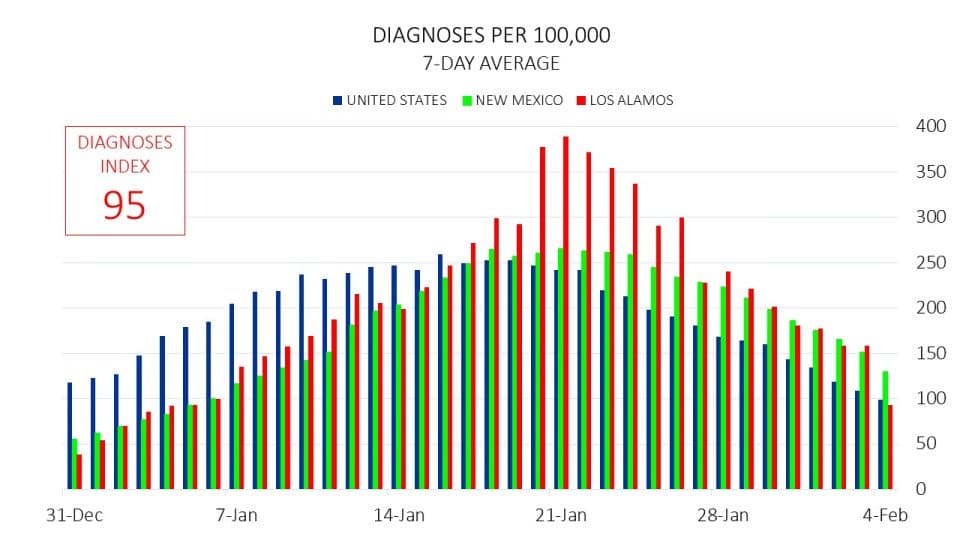 This chart shows the seven-day average number of COVID-19 diagnoses per 100,000 people versus date nationwide, statewide, and countywide. For the first time in three weeks, diagnoses in Los Alamos are lower than the national average and the state average. On a scale of 0 to 100, the diagnoses index quantifies the current level of diagnoses by using a comparison with daily levels since the start of the pandemic (the higher the index, the more severe the current state of the pandemic is). The current number of diagnoses in Los Alamos is higher than 95 percent of preceding days. Sources: New York
  CFFNM News: